How to Monitor Energy Using Home Assistant
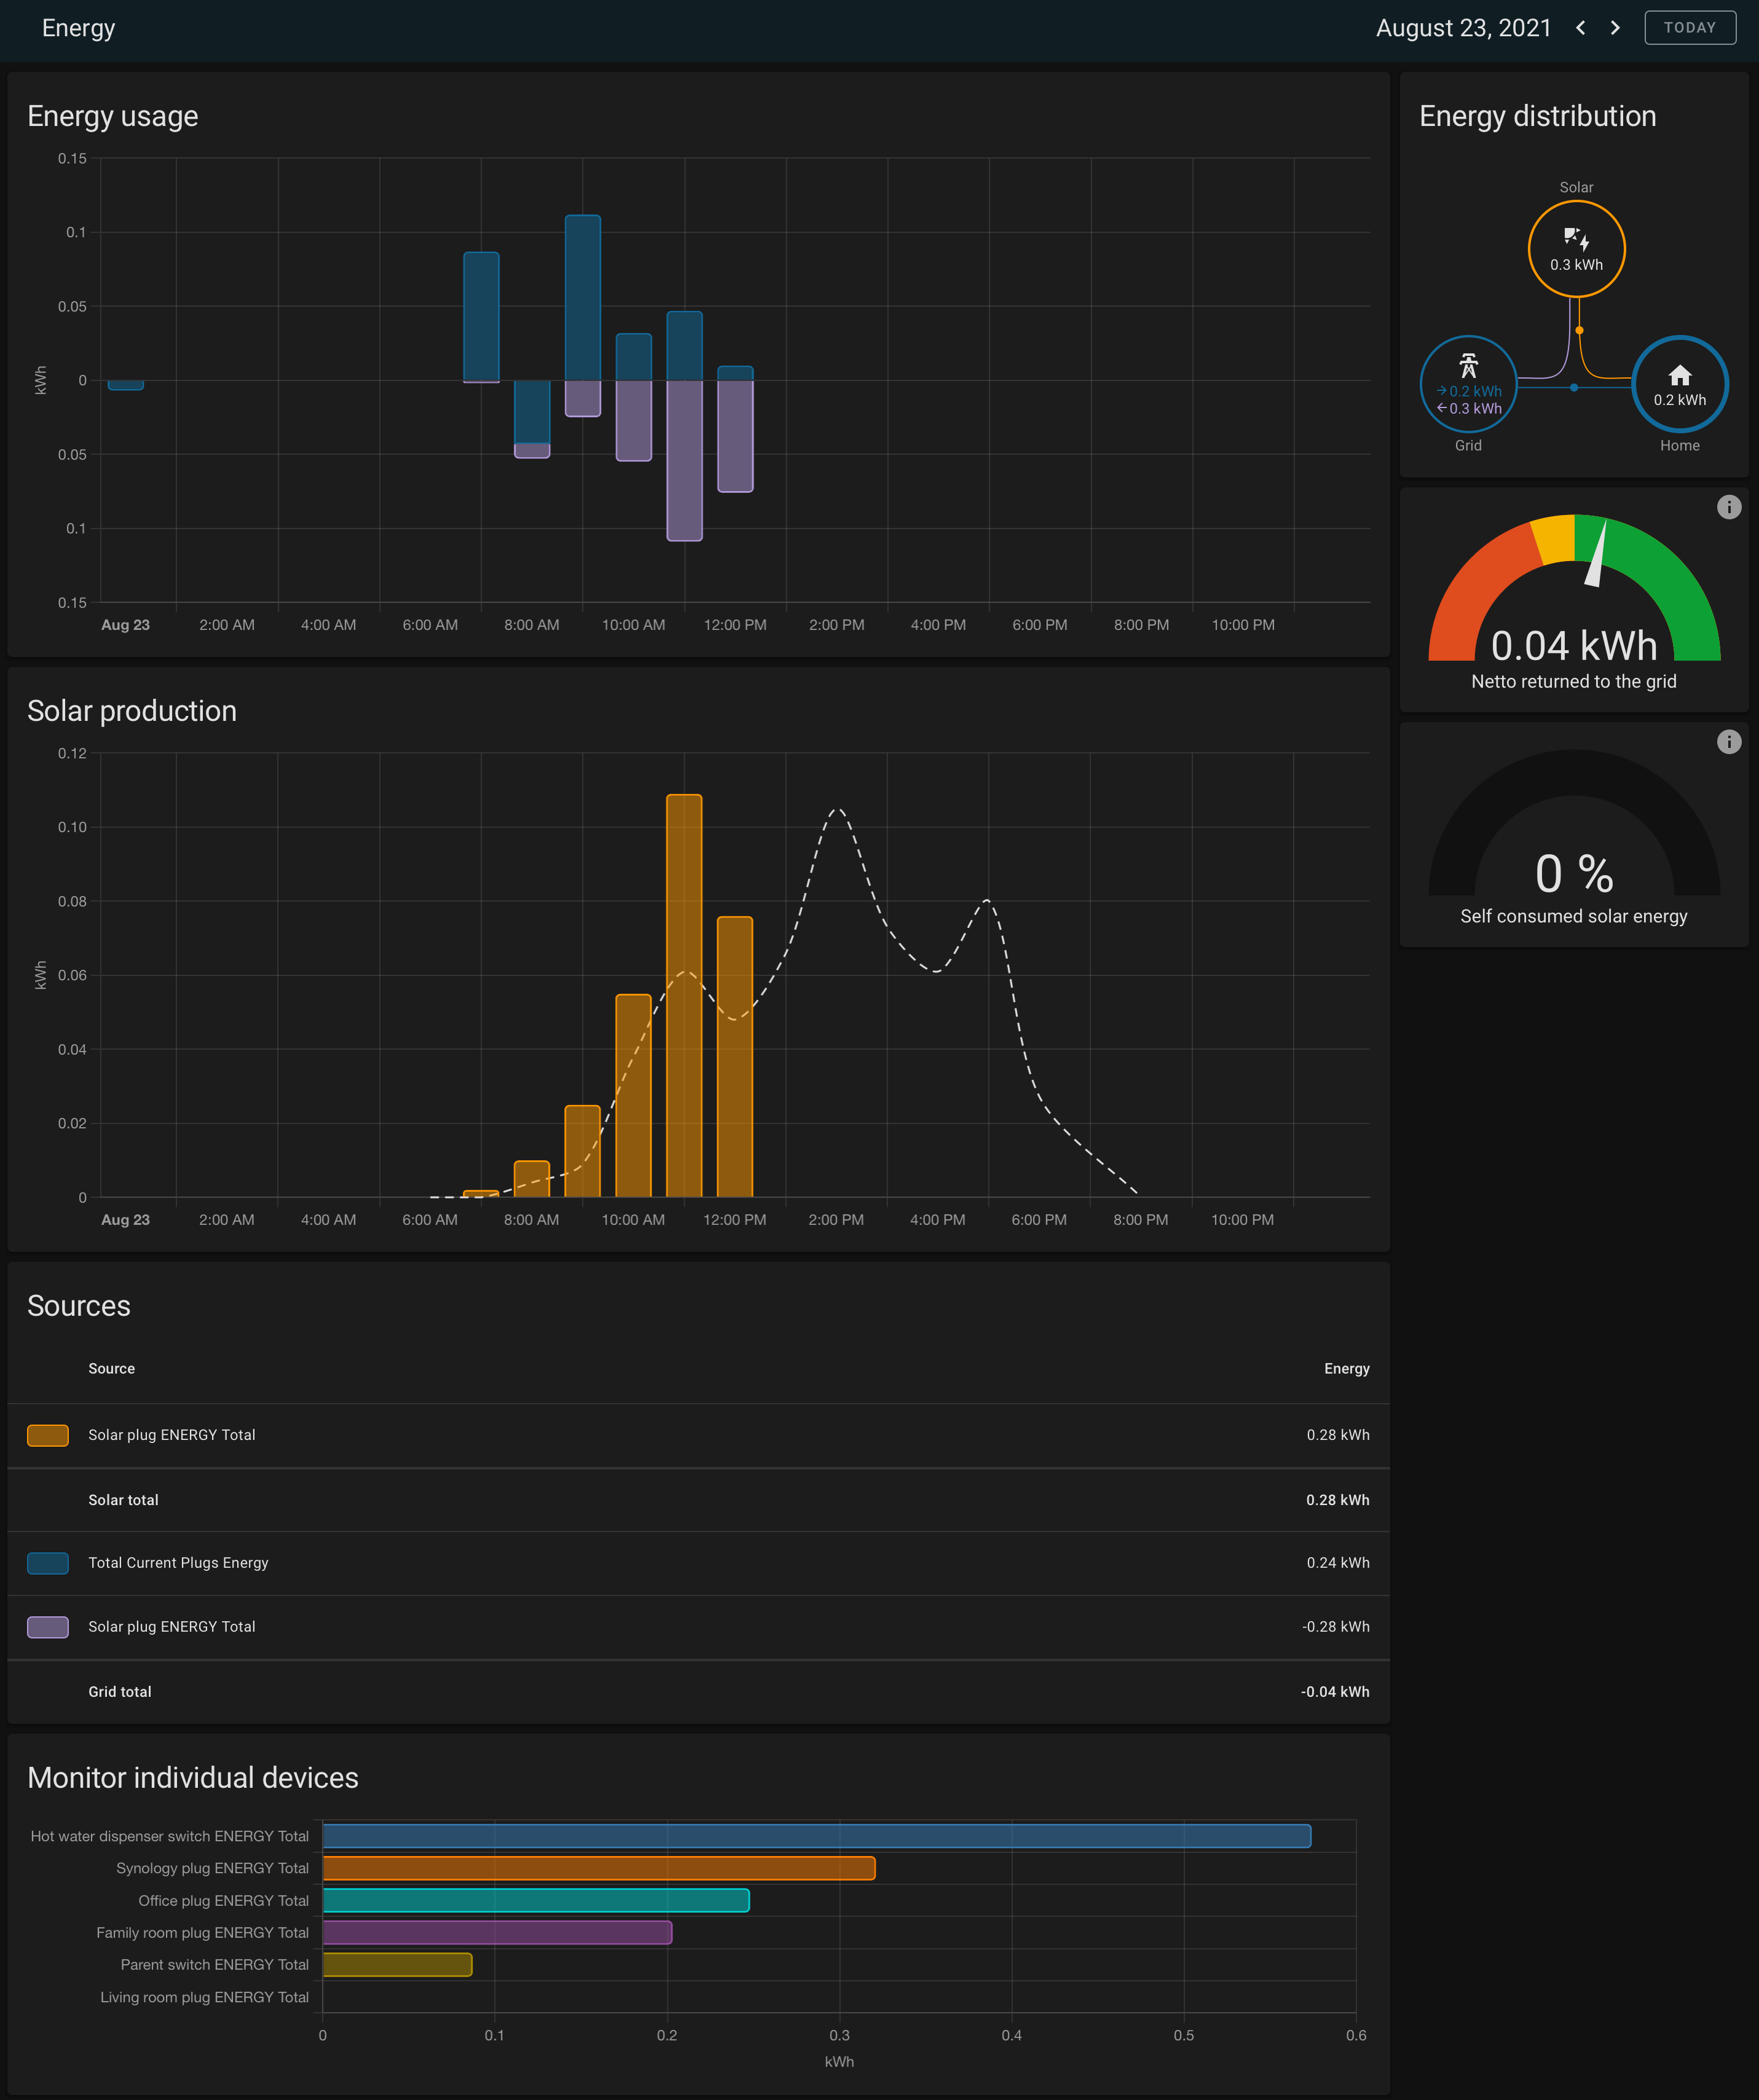
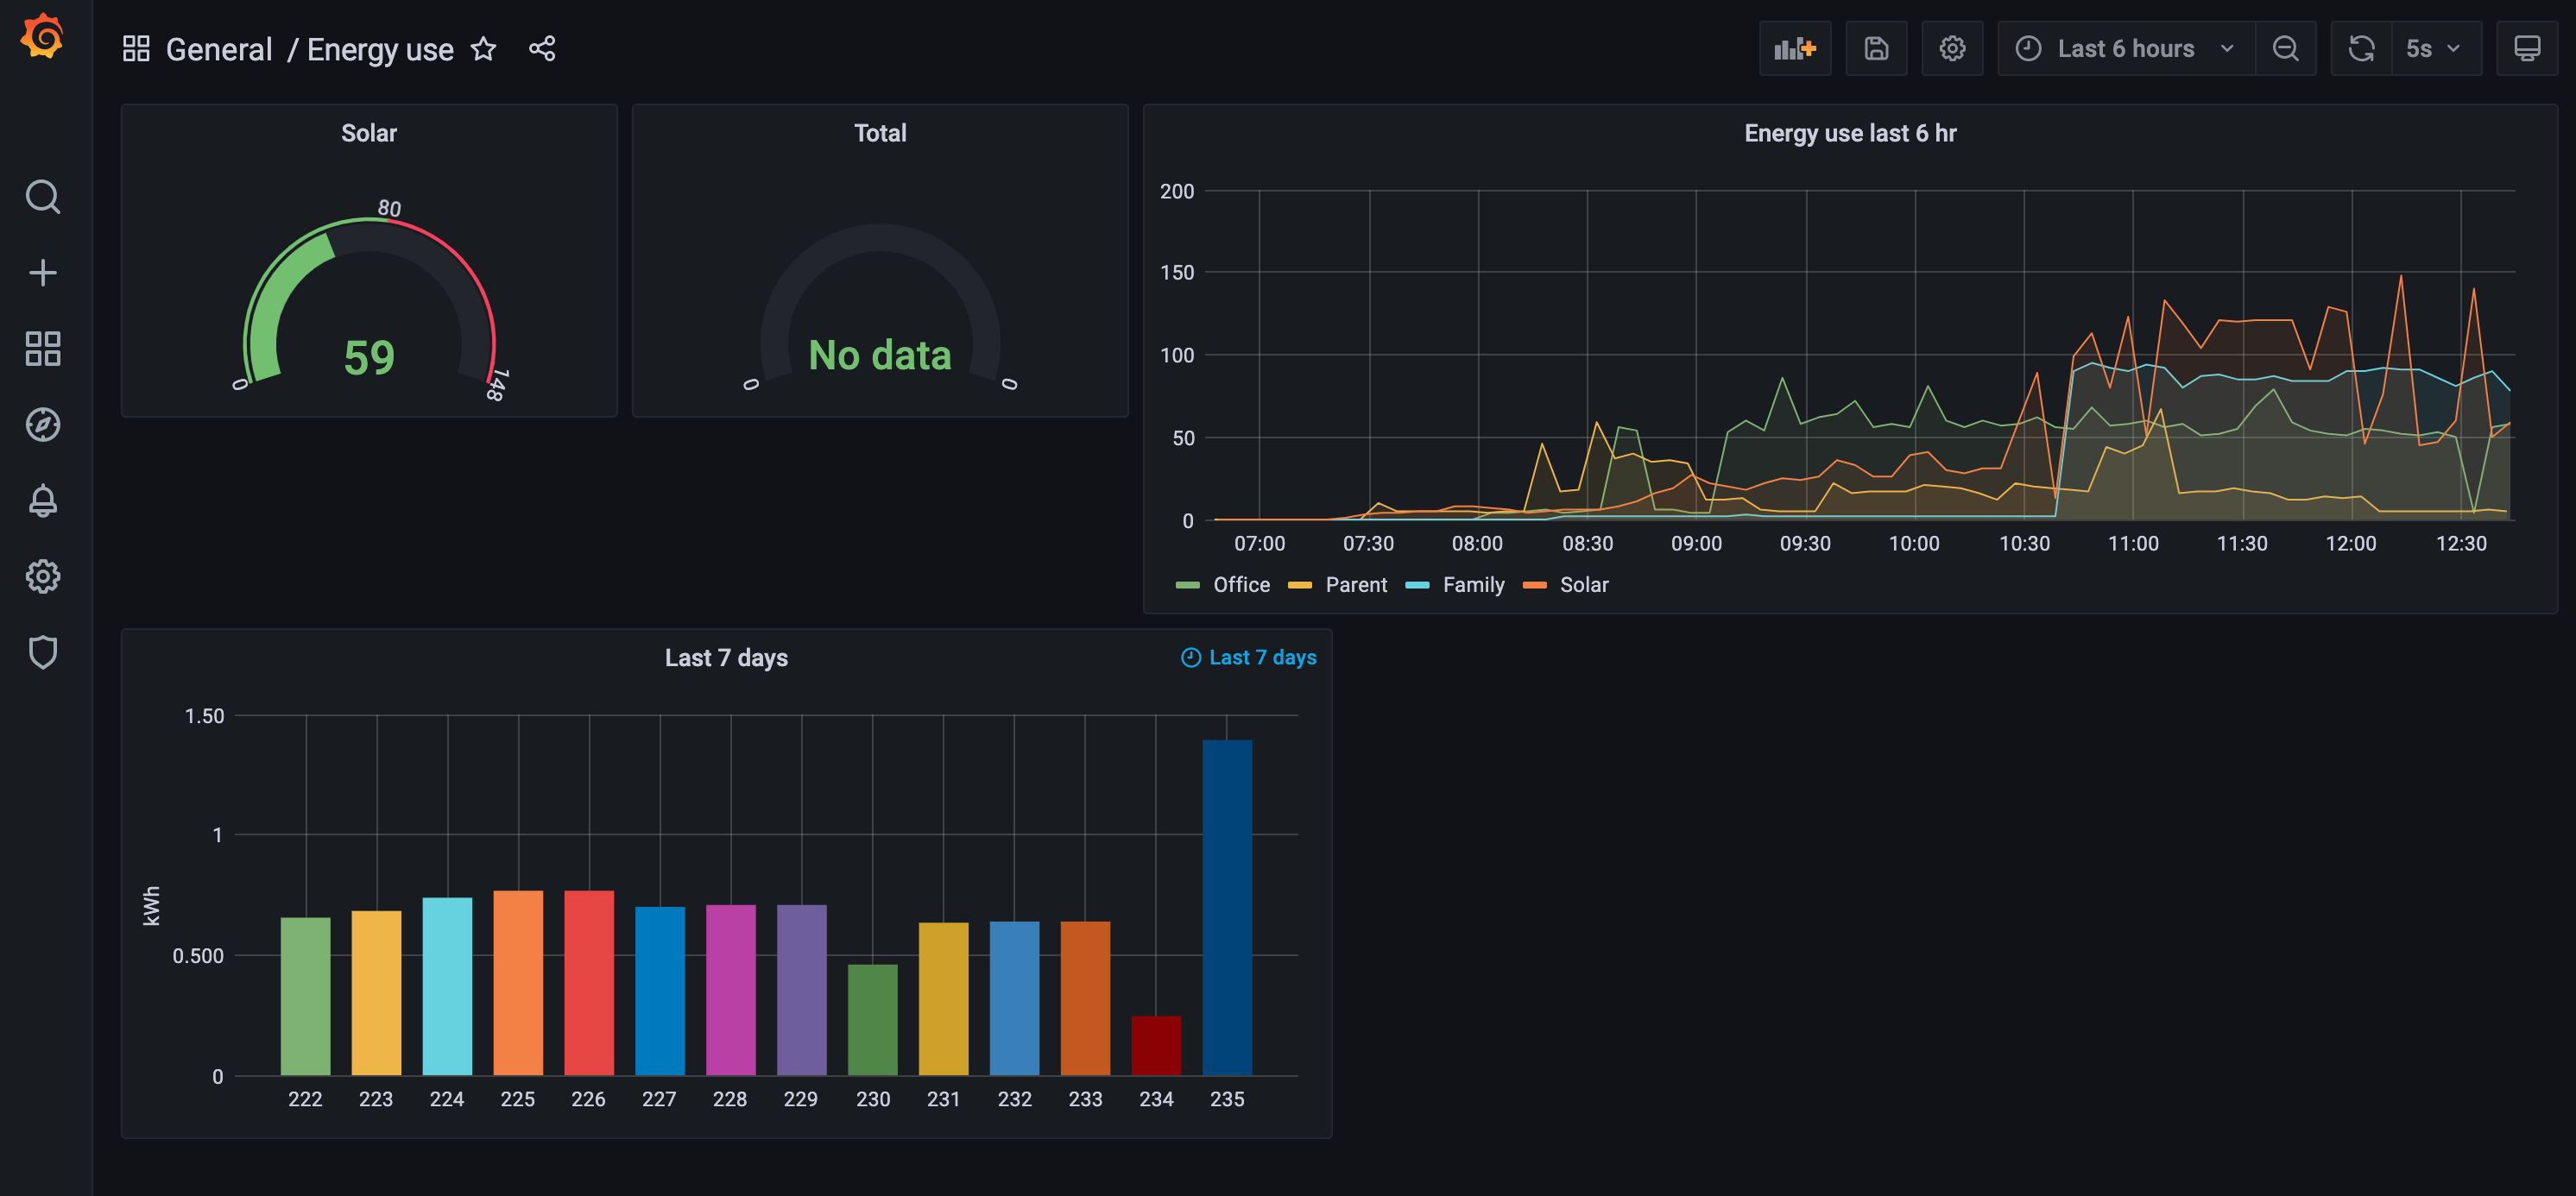
With the release of Home Assistant Core 2021.8, we no longer need grafana or influxdb to view real-time or historical energy usage in your home. I used to have a complex setup of a couple of separate docker containers only to achieve some simple energy monitoring tasks:
- Influxdb container to store timed data from home assistant since home assistant would not store historical data for extended period, e.g. 1 month.
- Grafana container to consume the influxdb data to plot the energy data into bar chart for statistics.
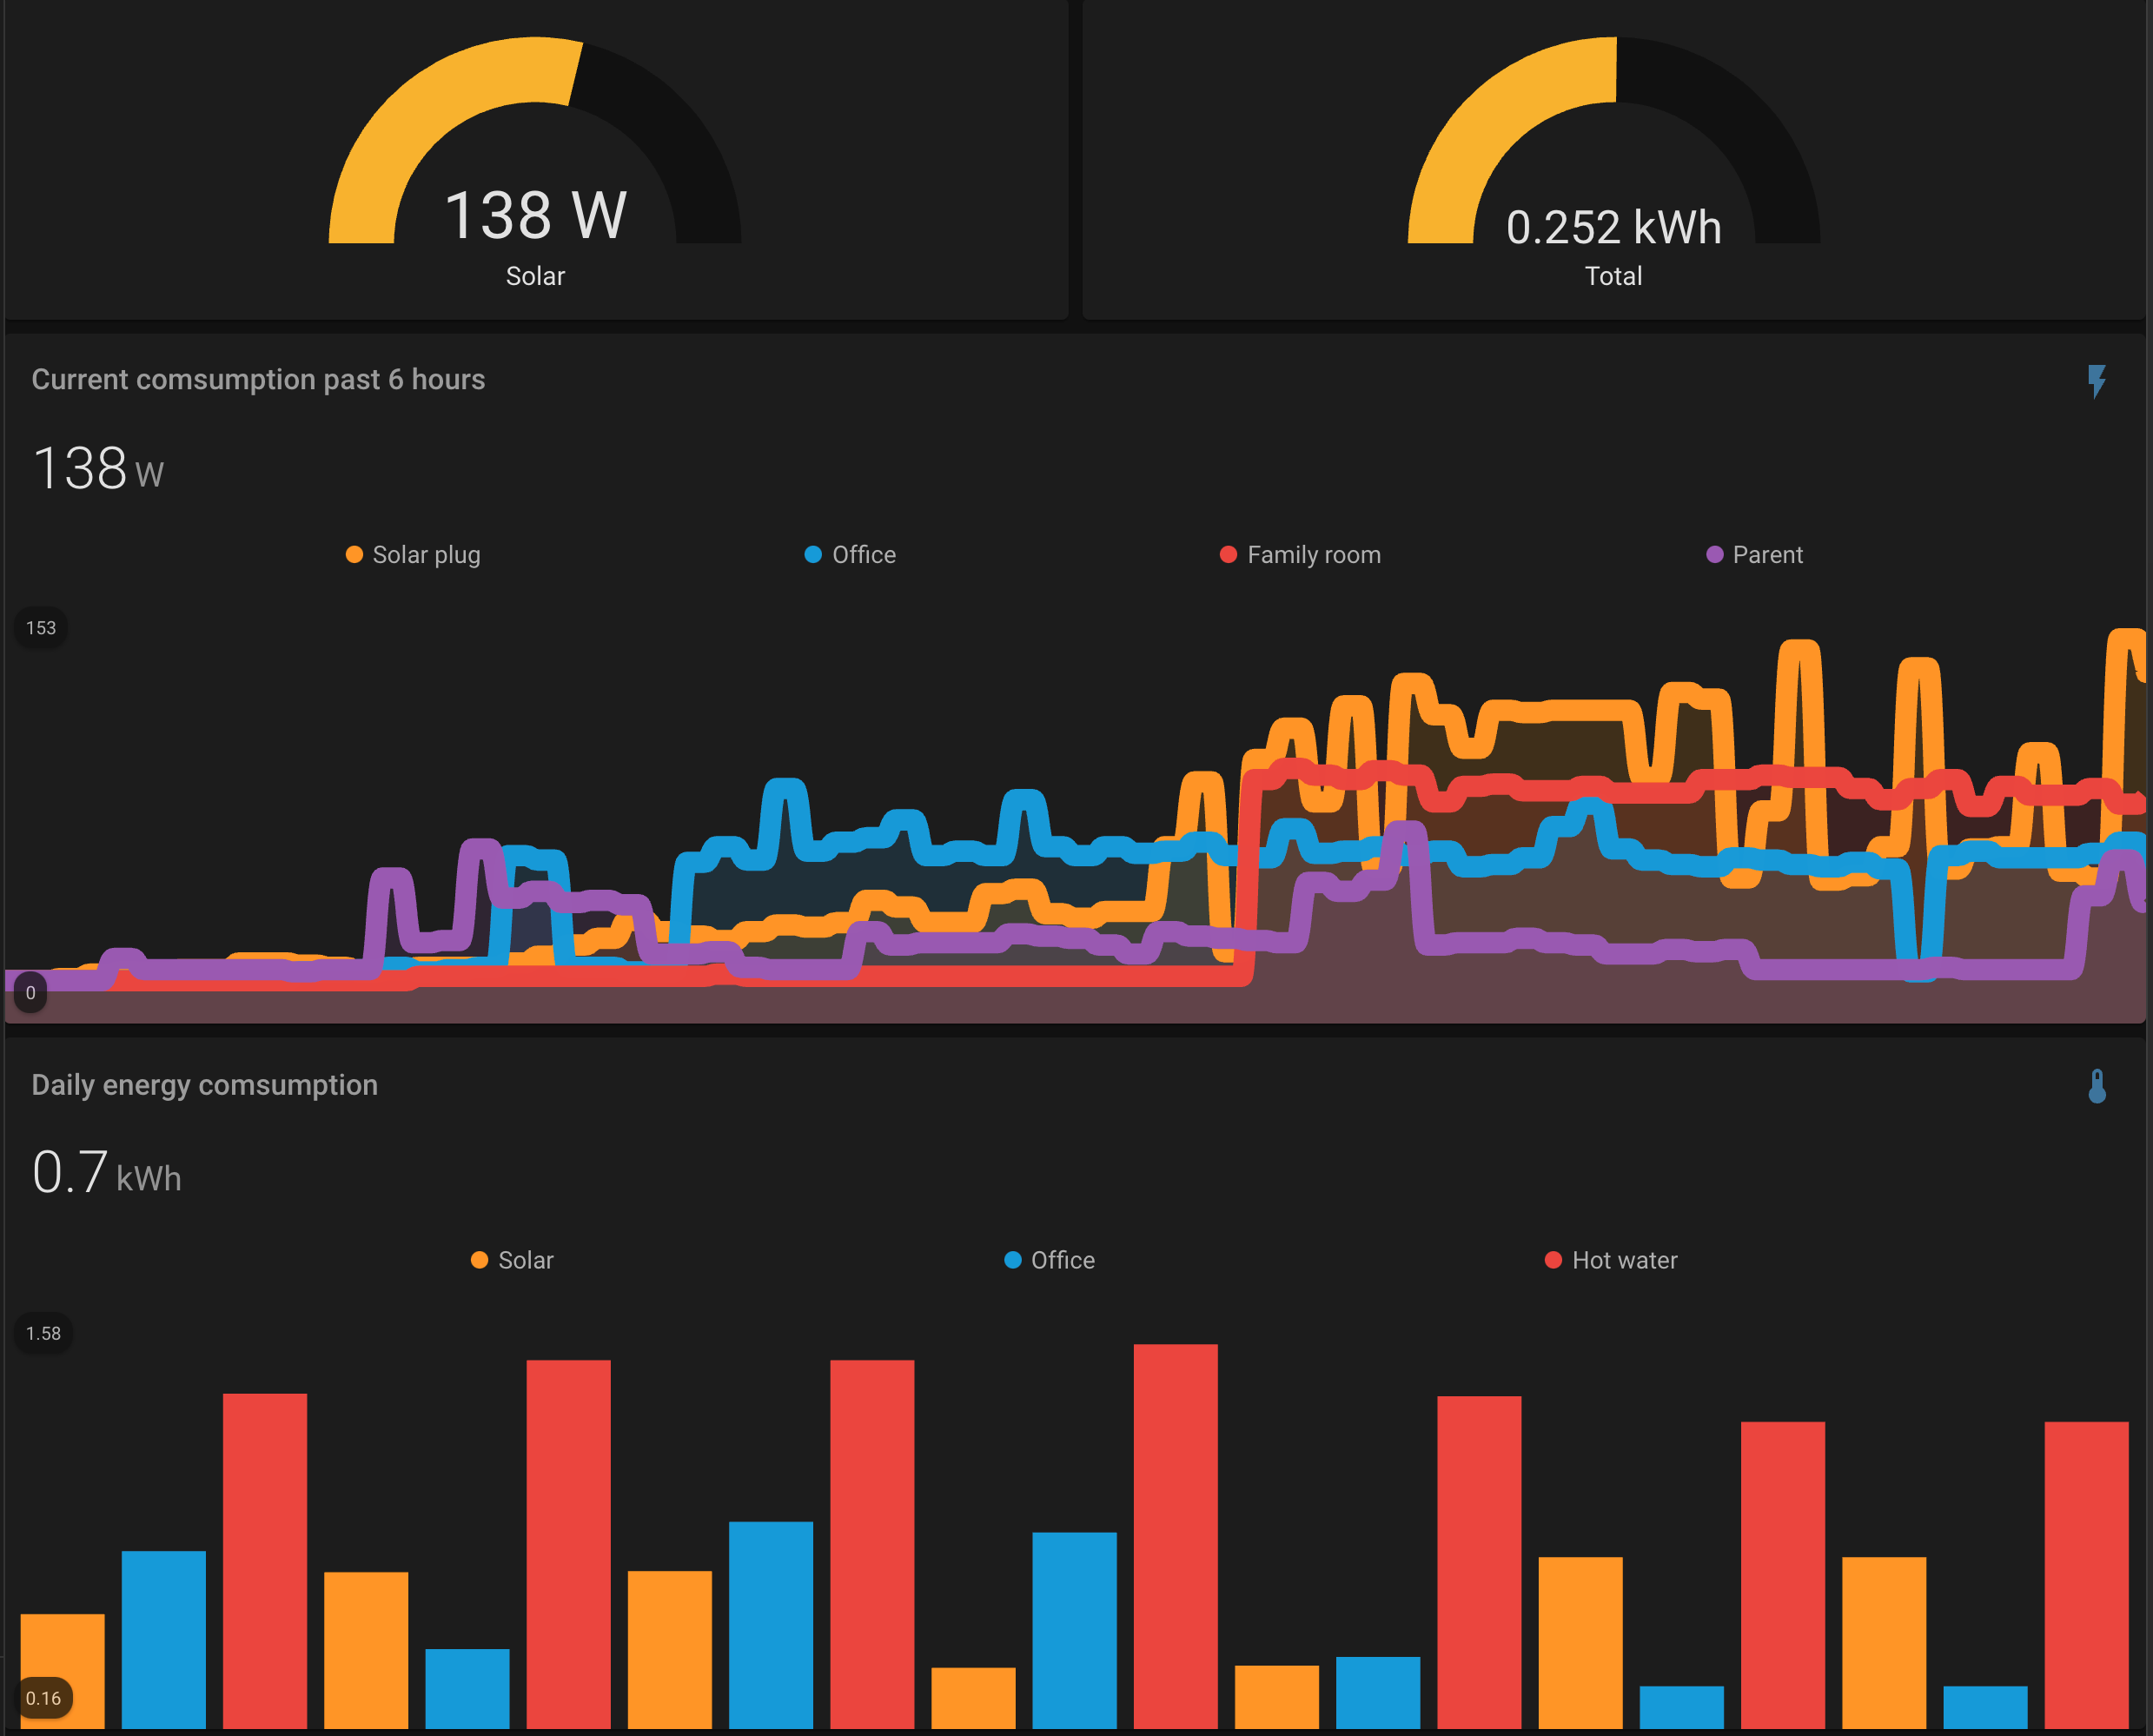
- Additionally some built-in and 3rd party lovelace UI components, like gauge and mini-graph-card.
The result wasn't too bad but feature-limited and cumbersome to setup, and not fully integrated with home assistant as I have to either go to grafana portal or use iframe to view the data.
| Grafana Energy Chart for Home Assistant | Lovelace Energy Chart for Home Assistant |
|---|---|
 |  |
Because I do not have a energy monitor device from my electricity provider, my power consumption are monitored individually from many Tasmota-powered power plugs throughout the home, even for my solar panel! This is a pure DIY and cheap solution if you don't want to invest dedicated energy monitoring devices yet would like to have a sense of your home's energy consumption/production.
The overall of my energy monitoring setup is:
- Tasmota-flashed smart plugs
- 3 pieces of 100W solar panel parallel connected to a grid-tie inverter
- Home Assistant Core > 2021.8
- A custom template sensor to sum up the total energy consumption collected by all the smart plugs
- Some tweaks to let the energy component recognize the template sensor for statistics
First of all, all the energy-monitor capable smart plugs need to be integrated with home assistant with the built-in Tasmota integration. Since home assistant energy expects some special attributes from energy monitor sensors, the sensor storing long-term statistics data requires the right properties. After some fiddling with the new sensor entity, I figured out the most important ones are unit_of_measurement, state_class and last_reset. The current power consumption data are collected and summed up then converted to kWh for easy reading.
Sample templates.yaml file
 1- sensor:
 2    - name: "Total Current Plugs Energy"
 3      unit_of_measurement: kWh
 4      state_class: measurement
 5      device_class: energy
 6      icon: 'mdi:gauge'
 7      state: >
 8        {{ (states('sensor.family_room_plug_energy_power') | int
 9         + states('sensor.hot_water_dispenser_switch_energy_power') | int
10         + states('sensor.livingroom_plug_energy_power') | int
11         + states('sensor.office_plug_energy_power') | int
12         + states('sensor.parent_switch_energy_power') | int
13         + states('sensor.synologyplug_energy_power') | int) / 1000
14        }}
15      attributes:
16        last_reset: '2021-01-01T00:00:00'
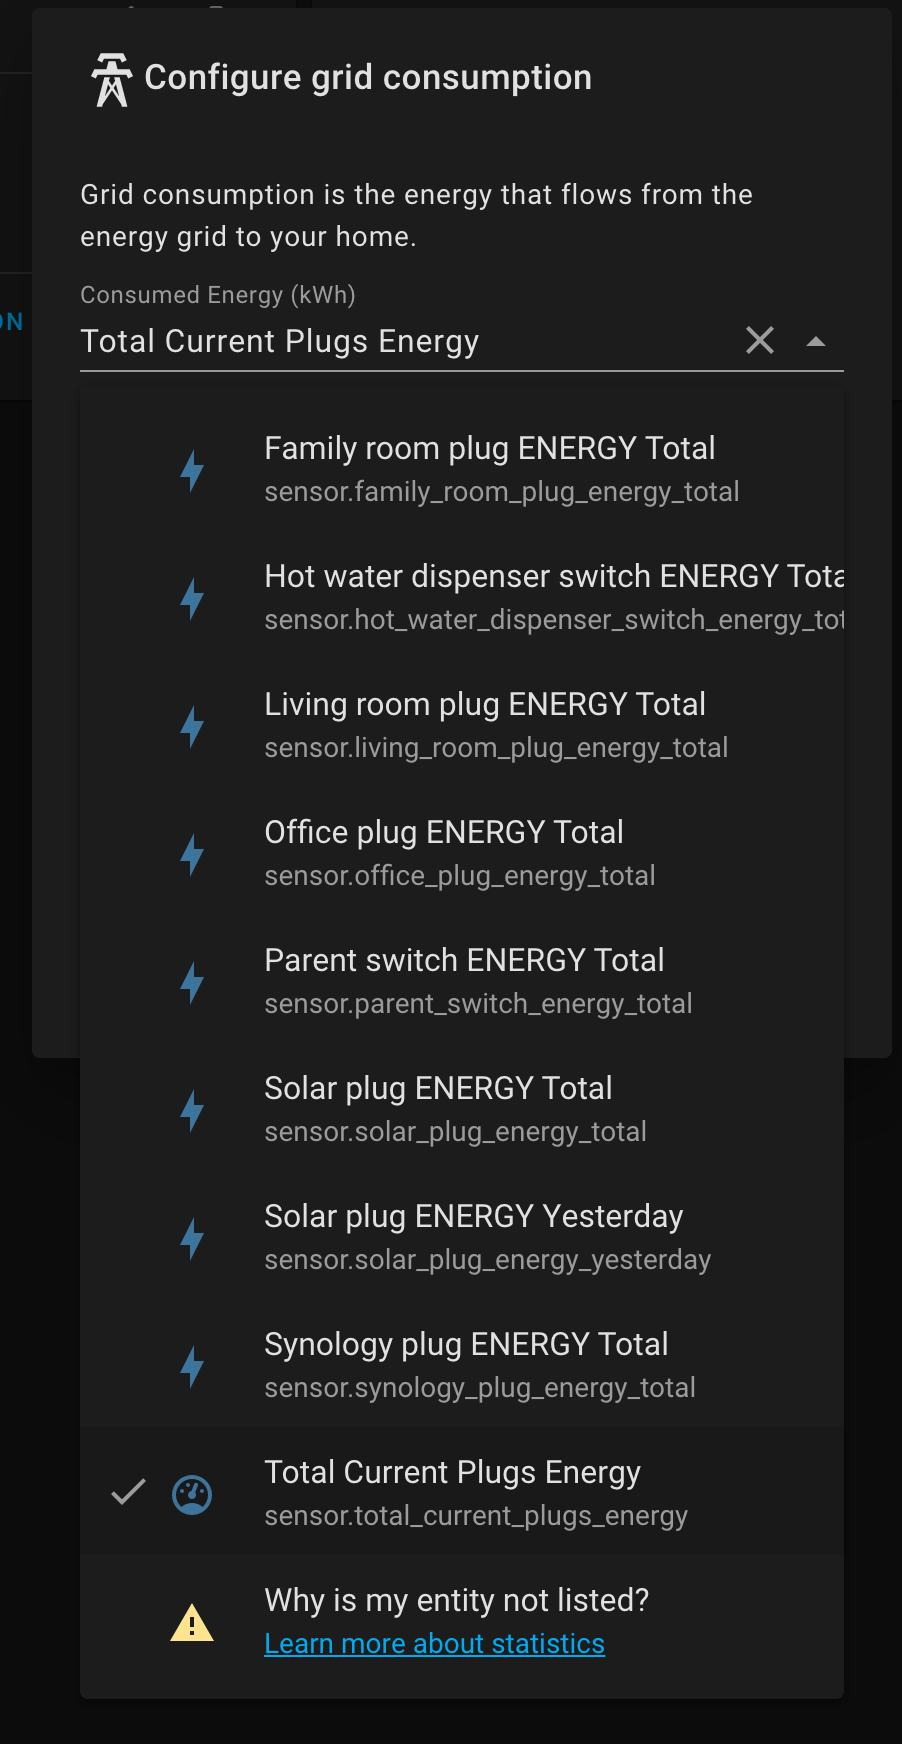
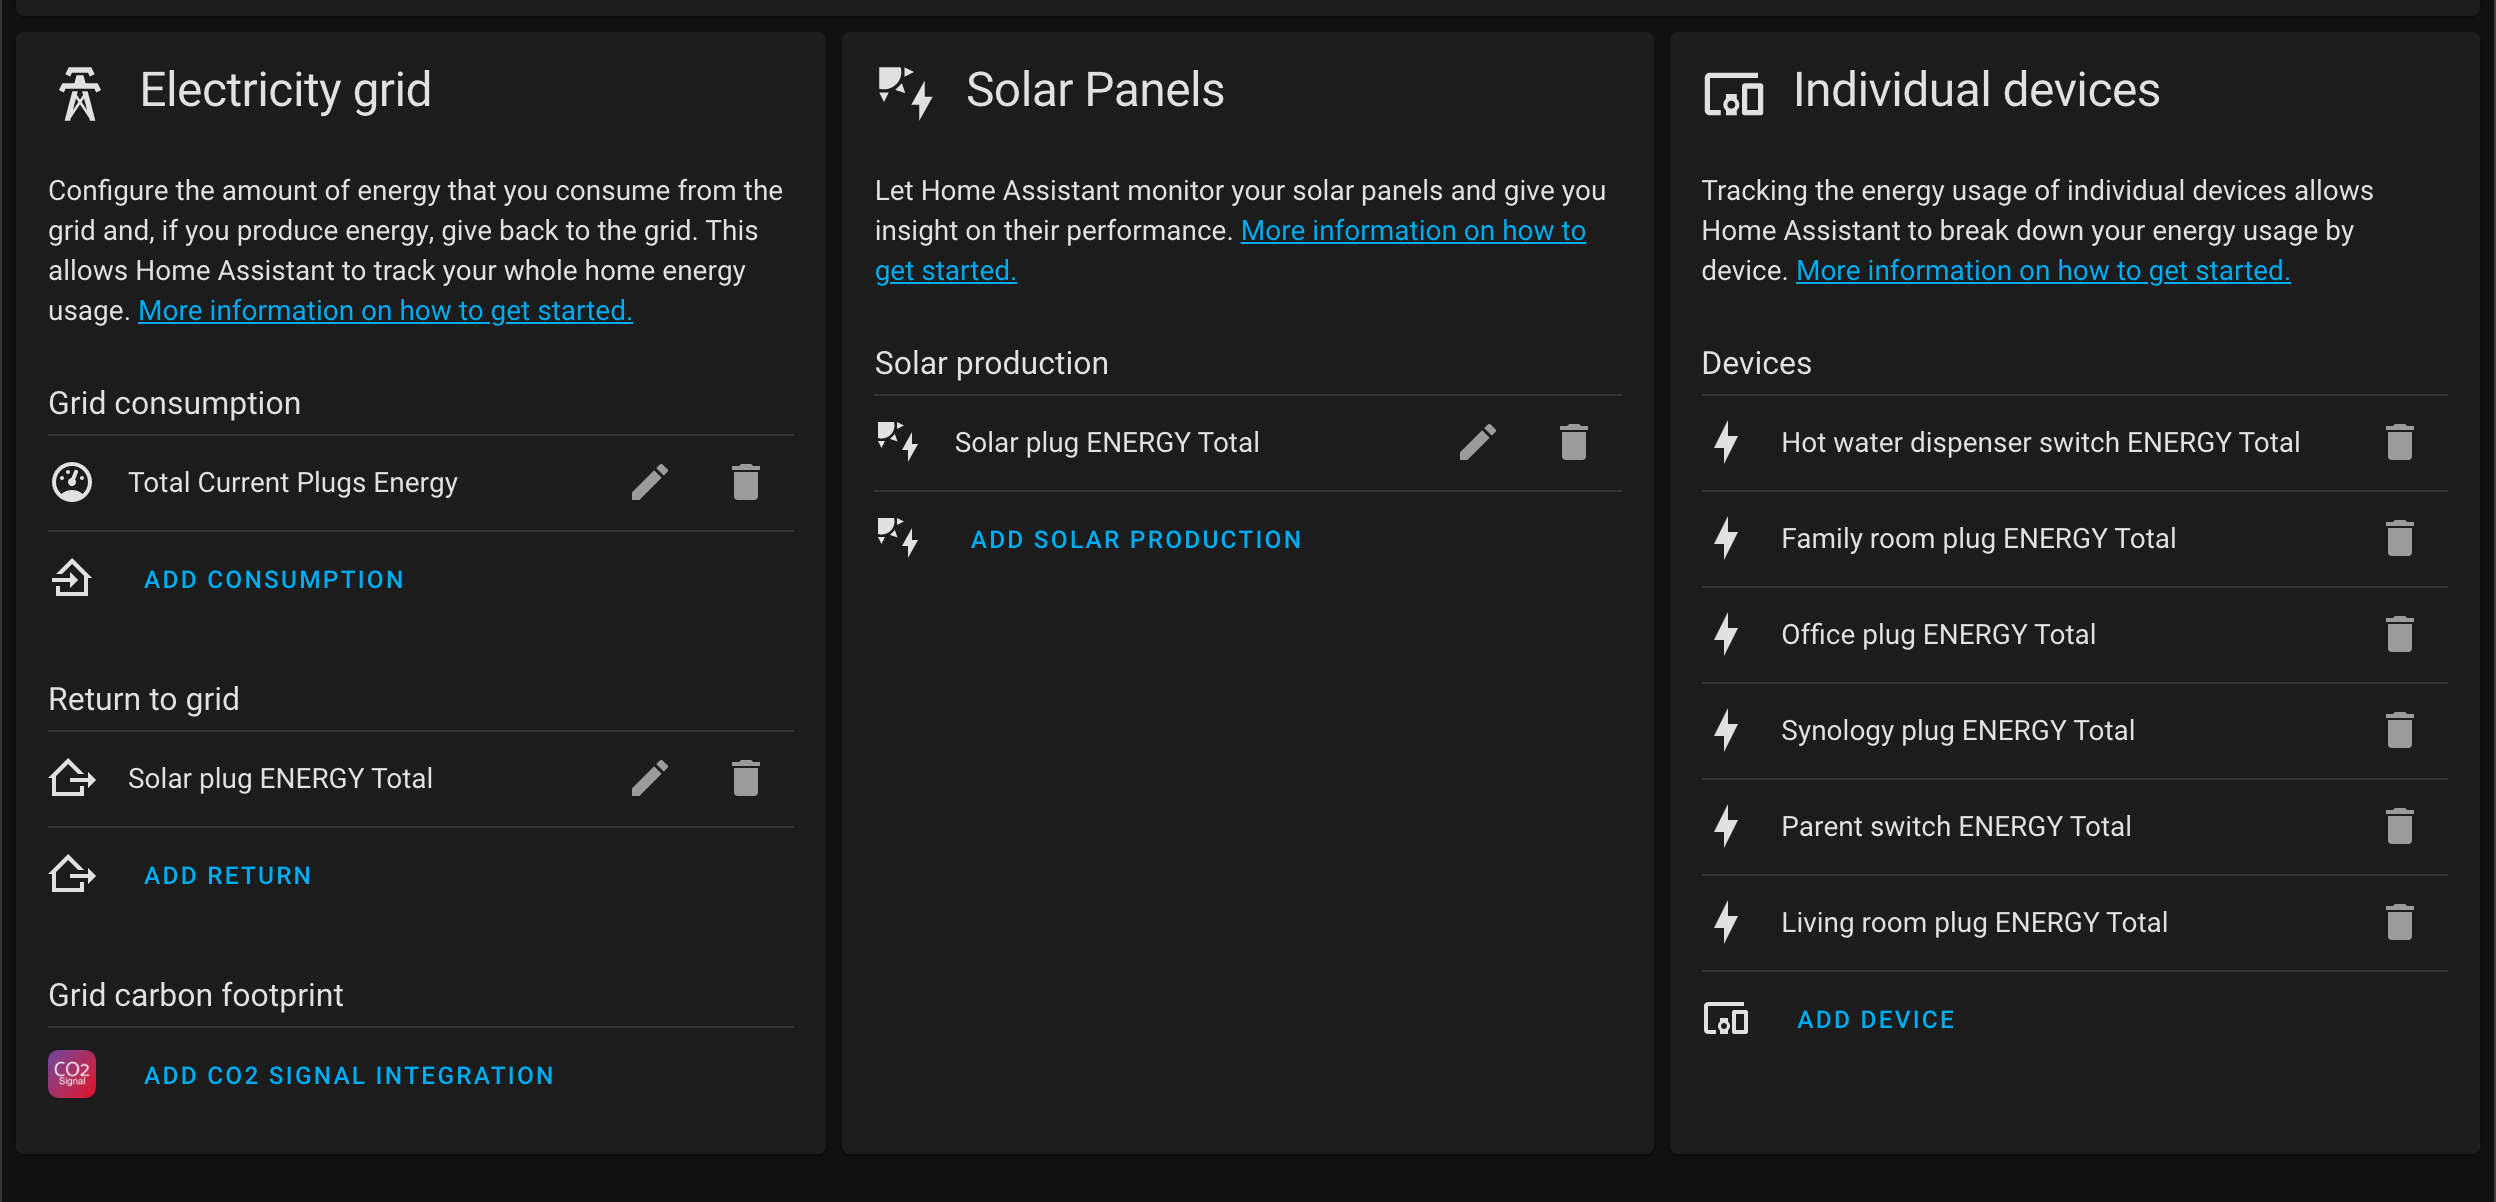
With the correct customization, the template sensor shows up in the energy configuration dropdown as below:
| Energy consumption dropdown | Energy Card Configuration |
|---|---|
 |  |
Now navigate to the energy section of the home assistant, and WOW you would see some beautiful outputs and graphics there! Although the chart does not represent my home's real total consumption and solar production, at least it gives me a snapshot of what's going on overall as well as each individual smart plug's energy usage. This is definitely a great step for home assistant. I used to spend days and night installing and configuring grafana and influxdb, but now I could achieve the same goal natively in home assistant within 10 minutes. Isn't that amazing?🎉🎊
The home assistant energy component is still relatively new, and I hope more features would get developed in the future.
